Level 1: MyFirstMalware.exe
Description:
The goblin laughs as you try to lift the manual and challenges you
to a binary duel.
7z Download
7z Password: labyrenth
Hint: BBz First Malware make u cry evry time
Author(s): @fdivrp

http://dl.labyrenth.com/myfirstmalware/5f008547232b8141316fc03d5a4108763ee108ab7c54199a673a69ab99551f67.7z
Alternate binary download link
Step 1: Initial triage & recon
$ file *
config.jpg:         data
MyFirstMalware.exe: PE32 executable (console) Intel 80386, for MS Windows
notdroids.jpg:      data
It’s likely a 32 bit PE, but things can get weird (see here). Let’s assume it’s not weird, carry on, and revisit this assumption if necessary. The ‘jpg’ files don’t seem to provide anything useful at this point.
$ strings MyFirstMalware.exe
!This program cannot be run in DOS mode.
Rich
.text
`.rdata
@.data
.rsrc
@.reloc
SVWd
There are certainly a few interesting potential imports, “IsDebuggerPresent”, “NtUnmapViewOfSection”. We also see a lot of wide character versions of the imports (e.g., the ‘W’ suffix on the import name FindNextFileW). Let’s try a different encoding, wide chars:
$ strings -e l MyFirstMalware.exe
Aapi-ms-win-core-fibers-l1-1-1
api-ms-win-core-synch-l1-2-0
kernel32
api-ms-
[...bunch of other stuff...]
CONOUT$
C:\notdroids.jpg
C:\config.jpg
Microsoft Enhanced Cryptographic Provider v1.0
7ZfKiuNbDcmXJvzRuVHRiD4pH6EEApCmb4ciUmzbH6TXEh7nmuQ3LghuGx38t2BT
7ZfKiuNbDcmXJvzRuVHRiD4pH6EEApCmb4ciUmzbH6TXEh7nmuQ3LghuGx38t2BX
That starts to look a little more interesting. Perhaps we’ve found a place for the supplied ‘jpg’ files, and maybe some decryption keys.
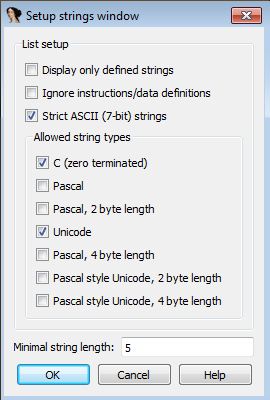
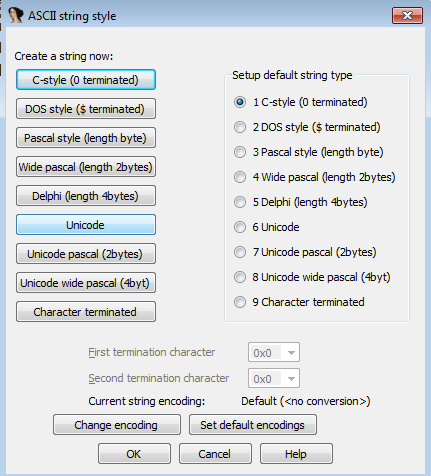
We load the binary in IDA, get our line prefixes (Options -> General -> Disassembly -> Line prefixes), then check the strings (Shift+F12). Right click anywhere in the strings window to access the setup for strings (or Ctrl+U)
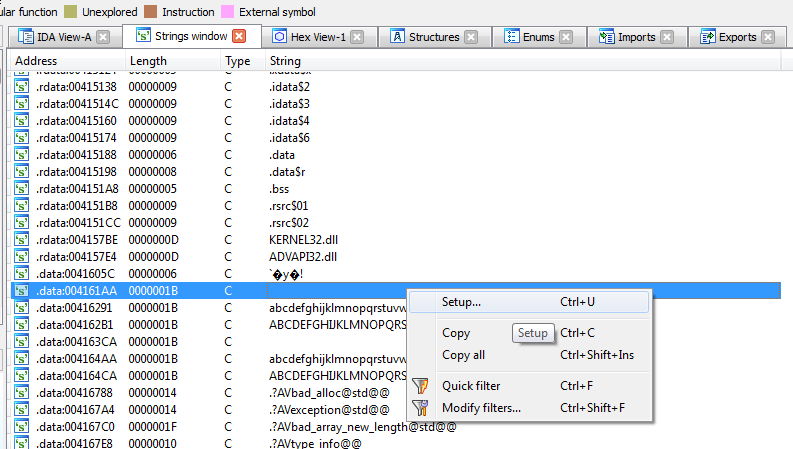
then check the Unicode box
Since we are expecting some anti-debug tricks, we familiarize ourselves with the techniques presented in the following reading list:
- Anti-debugging and Anti-VM techniques and anti-emulation
- Chapter 16 Practical Malware Analysis
- Anti-debugging Techniques Cheat Sheet
- Anything else that pops up on a google search for something like ‘anti-debugging malware’
We’re going to use a nice plugin called ScyllaHide.
Grab the 1.2 rar, unrar it, and copy HookLibraryx86.dll, NtApiCollection, and ScyllaHideIDA.plw into the plugins directory of your IDA installation. Open IDA again (Run as administrator), and ScyllaHide should be ready, you can check the options from the Edit->Plugins, or alt+x.
We’re not quite ready to go dynamic yet, though.
Using the same idea of tracking the xrefs as we did at the beginning of the AntiD analysis, we quickly locate where the potential keys are being used. We want to get an overview of how we’d end up in this function, and where it’s going to go.
We check xrefs of strings that are visible, to see if they are read/written anywhere else. If not, it helps us rename functions based on their use of certain strings. We take a quick look inside some functions and see if anything in particular stands out about the APIs they are using. We rename some things on a best guess basis, remembering that we are guessing at the functionality. It helps to rename things even if you don’t know exactly what it does, you’ll remember it better than just a generic sub_12345 or dword_1234 and it’ll make more sense when you see it used/called somewhere else. It’s also helpful for images that rebase/relocate (as this one does). Although we can disable that by editing the PE header or rebase the program in IDA afterwards.
It is worth spending some time here, and you may want to pull up the MSDN documentation for API calls to get a better idea of what’s going on.
For example, based on the arguments to these APIs, and their return values
we can rename var_2F4 to NtUnmapViewOfSection
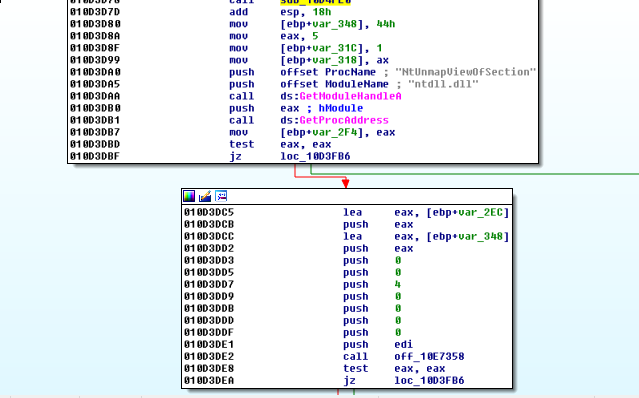
and checking the xrefs or scrolling around to see it highlighted elsewhere, we find this:
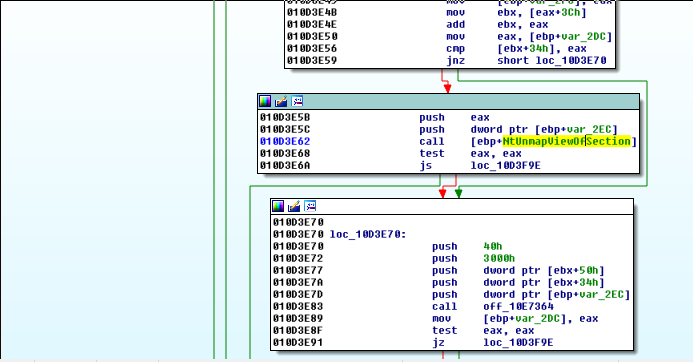
Looking this call up on MSDN…things get a little cryptic, but if we google “NtUnmapViewOfSection” then we quickly clue in
It’s something to watch out for, and certainly makes this function very interesting. We can go down this rabbit hole for a bit, but let’s add to our high level overview first. We step back out into the function that called this possible process hollower, and keep renaming.
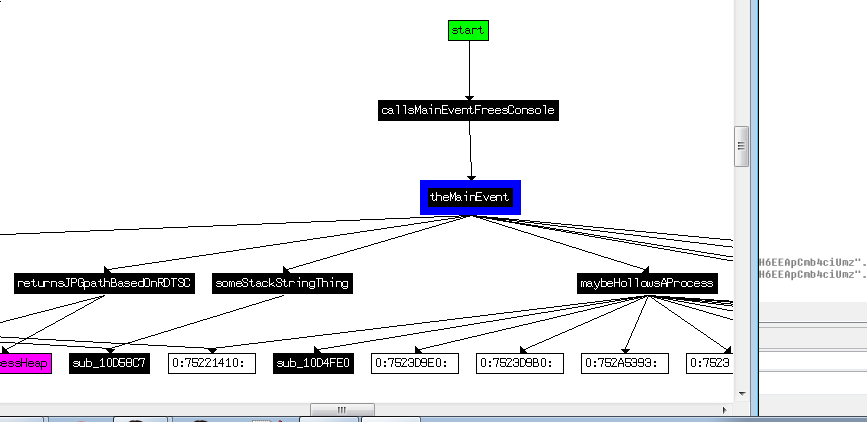
Ok, with a bunch of things in the neighbourhood renamed, we can start exploring outwards a little more. We could scroll up to the top of the first basic block of our function (now called theMainEvent, and press x with the name highlighted to see who calls this function…and then keep moving backwards like that…or we can look at the Function Calls chart (View -> Graphs -> Function calls or Ctrl+F12).
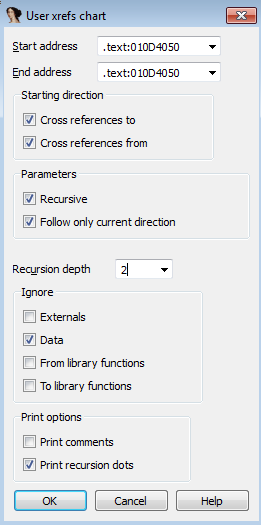
It doesn’t look too friendly, so we build our own (View -> Graphs -> User xrefs chart).
We specify a maximum recursion depth of 2, so we can get an idea without being overwhelmed.
Step 2: Dynamic Analysis
Ok, maybe time for some dynamic analysis.
We set breakpoints at the top of the most interesting functions, including the one that calls theMainEvent, and step through carefully, examining memory as we go and renaming the mystery variables according to what else we observe. Especially interesting are all these mystery offsets that are being called, and will be resolved at runtime (we can do more static analysis to get a better idea, but this is the gotta go fast edition after all)
The mystery offsets have been resolved. We double click on one of them and examine its neighbours. We can go on a new renaming spree at this point or we can rename as we go. We start in the callsMainEvent function and mouse-over the calls to see what they resolved to. CreateMutex (off_127354) may become interesting later, but for now Sleep (off_1273A8) is the focus.
.text:00114100
.text:00114100 callsMainEventFreesConsole proc near
.text:00114100 push    offset aGlhf    ; "glhf"
.text:00114105 push    1
.text:00114107 push    0
.text:00114109 call    off_127354
.text:0011410F call    ds:FreeConsole
.text:00114115 push    15F90h
.text:0011411A call    off_1273A8
.text:00114120 call    theMainEvent
.text:00114125 movzx   eax, al
.text:00114128 retn
.text:00114128 callsMainEventFreesConsole e
We really don’t want to wait for no reason, so we’ll patch this call. We have several options:
- Keypatch to patch this call
- Python to open the file and edit the bytes to either nop out the call or change the Sleep arg. As seen on gynvael’s blog
- Change the argument pushed onto the stack for Sleep inside of IDA
For this binary, we’ll go with the last option.
We click in the hex view at the bottom, press g, and enter the address where push 15F90h lives. Press F2 (or right-click Edit), and replace the 90 5F 01 00 (little endian) with 00s, then press F2 again to apply changes (or right-click and Apply changes).
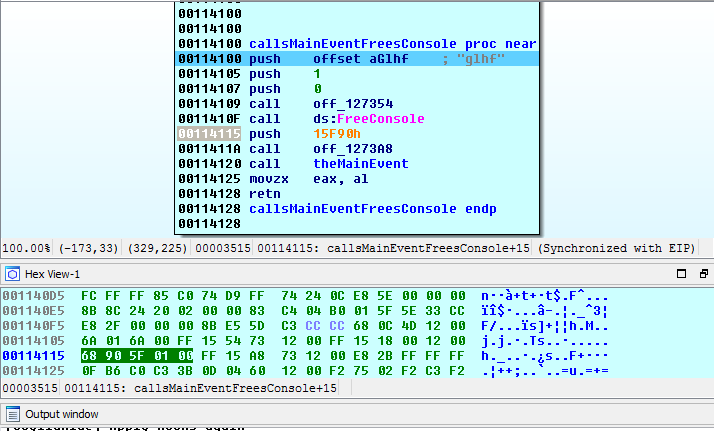
Now we can keep stepping without wasting time on this Sleep call.
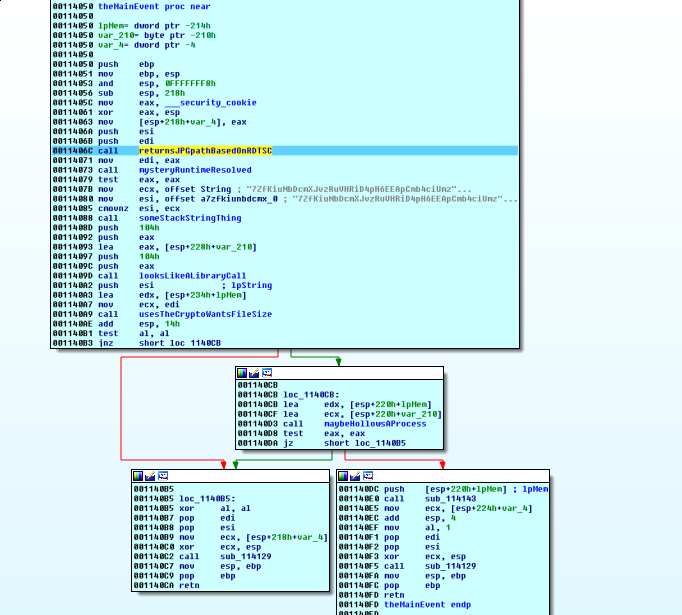
We step inside the returnsJPG function. It seems to pick a path string based on the result of some calculations on the values returned from the rdtsc instruction. The read time stamp counter anti-debug trick is covered in the anti-debug links earlier in this post.
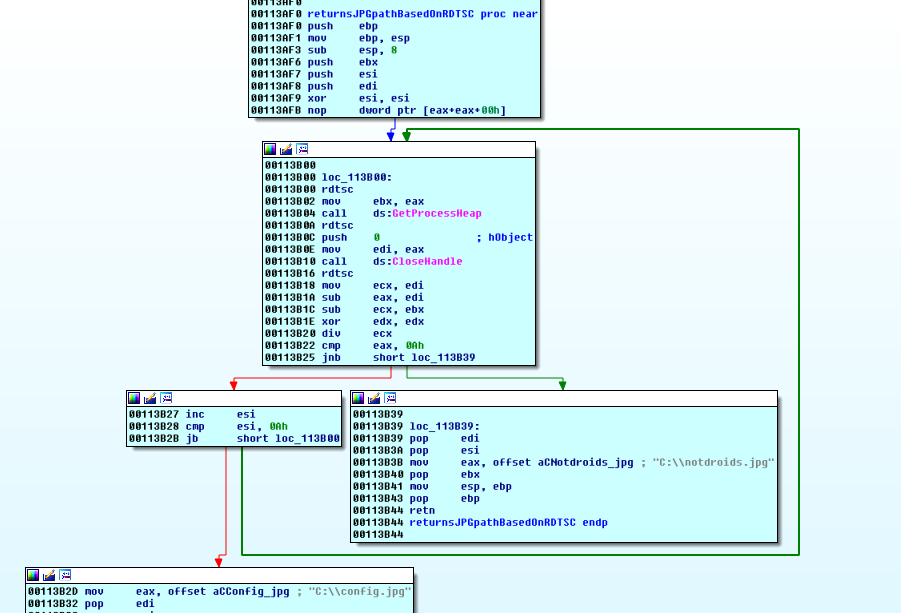
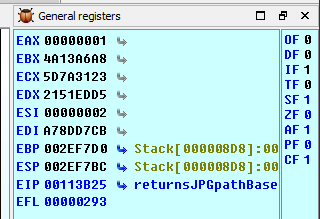
We can play the timestamp counter game, or we can just flip a flag and be on our way.
In the registers window at the far left, click on the CF (carry flag) and either press 0 or hit spacebar to toggle it. This will cause the jnb instruction to branch to the block with the notdroids.jpg path instead.
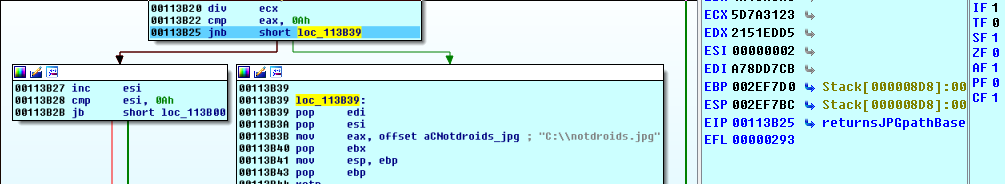
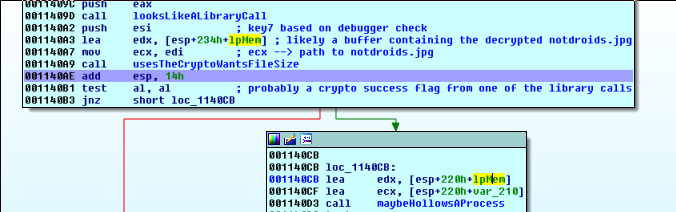
Back in theMainEvent, it seems clear why two key-IVs were given (cmovnz).
Making use of the comment feature (click on a line and press shift+; or just ; for a repeatable comment), we start to get an idea of what’s going on.
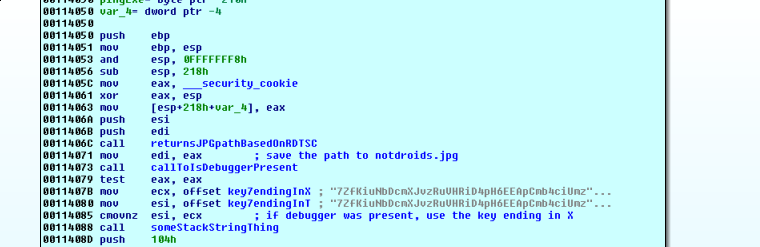
We step over the IsDebuggerPresent call, noting that eax is 0 and scylla hide has us covered.
We take a closer look at the stack string thing, and notice that all the characters which are not null in the printable ascii range…this is really just building a wide character string wherever eax is pointing. Ok, let’s just see what eax is after this function has finished.
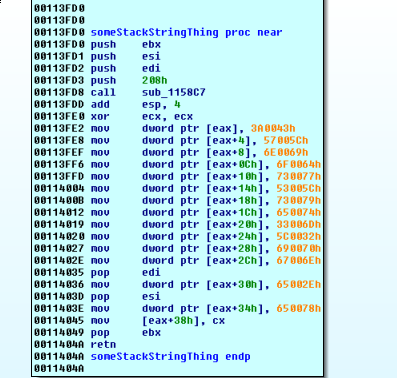
click on the arrow that the eax register has and examine that string
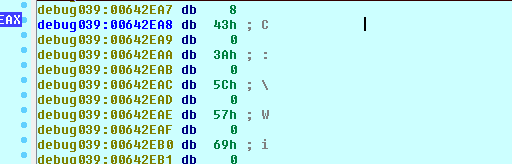
We know it’s a unicode string, so we click the first byte of the string, press alt+a, and select unicode

This may be the process that will be hollowed.
We step over the scary crypto (or step through and settle in for some nice MSDN reading), and examine the ‘lpMem’ buffer with a double-click after the crypto function has finished executing.
Hmm…it’s not looking all that good
Stack[000008D8]:002EF7E0 dd offset unk_640072
Stack[000008D8]:002EF7E4 db 0B0h
Stack[000008D8]:002EF7E5 db  29h ; )
Stack[000008D8]:002EF7E6 db  65h ; e
Stack[000008D8]:002EF7E7 db    0
Stack[000008D8]:002EF7E8 db  43h ; C
Unless…it’s a pointer. Click on the 0B0, and cycle through the different data options by pressing d until it’s a double word (dd).
Stack[000008D8]:002EF7E4 dd offset unk_6529B0
We double click this unk and end up here:
debug039:006529B0 unk_6529B0 db  4Dh ; M                  ; DATA XREF: Stack[000008D8]:002EF7E4o
debug039:006529B1 db  5Ah ; Z
debug039:006529B2 db  90h ; É
debug039:006529B3 db    0
debug039:006529B4 db    3
debug039:006529B5 db    0
debug039:006529B6 db    0
that’s a nice few bytes!
Ok, let’s be a bit lazy.
Scroll down until you see
debug039:00652BA8 db  2Eh ; .
debug039:00652BA9 db  74h ; t
debug039:00652BAA db  65h ; e
debug039:00652BAB db  78h ; x
debug039:00652BAC db  74h ; t
Now we know we’re out of the header. Let’s dump at least this many bytes and find the real size of this .exe with CFF explorer.
Once we know the real size, we can dump the entire .exe
0x652BA8 - 0x6529B0
$ pcalc 0xba8 - 0x9b0
	504             	0x1f8             	0y111111000
In the IDAPython console at the bottom, we type:
f = open('c:\\users\\ctf\\desktop\\theBasics.exe', 'wb').write(GetManyBytes(0x6529B0, 0x1f8))
CFF explorer helps us locate the size of the image in the header: 0x19000 bytes.
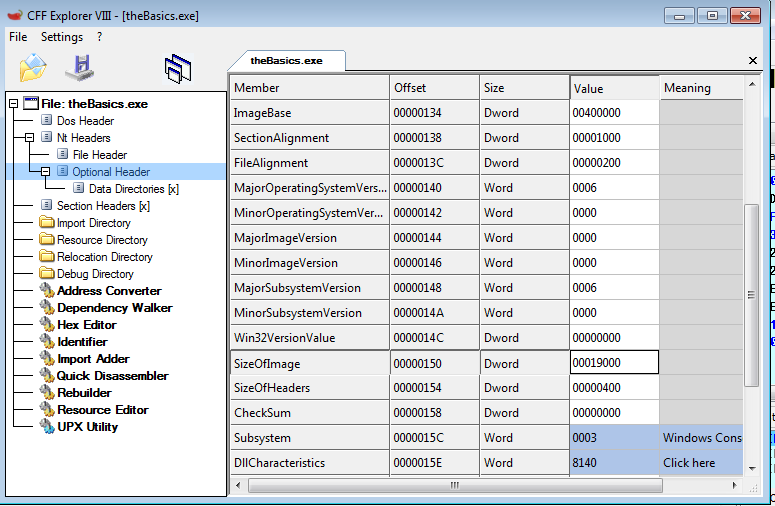
f = open('c:\\users\\ctf\\desktop\\theNext.exe', 'wb').write(GetManyBytes(0x6529B0, 0x19000))
If that didn’t work, try a quick RefreshDebuggerMemory() in the console.
We could also have followed the binary as it hollowed the process, and debugged the hollow process. See this helpful blog post and comments for various ways to do so.
Step 0:
Let’s start over and analyze this new .exe.
Applying all the same methodology as the first exe. We quickly arrive at a function very similiar to theMainEvent. Things look a little simpler this time though. Let’s just examine what the decrypted buffer looks like this time (noting that config.jpg is the desireable file this time in the rdtsc function).
Note that the file size of config.jpg holds some promise. We are probably not going down another .exe rabbit hole.
We examine the buffer that is passed as the argument to the crypto function.
And we win
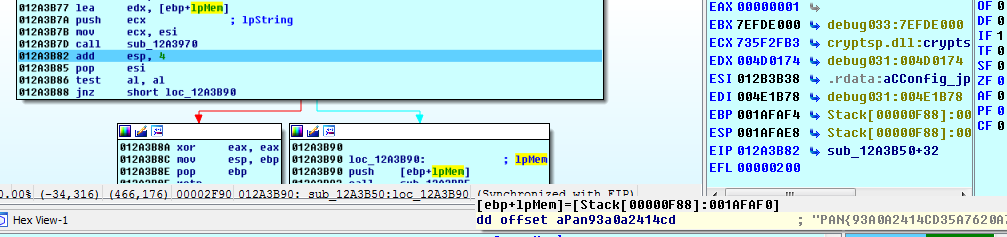
PAN{93A0A2414CD35A7620A7FD23ECEF187F08FBC5728229614B18EEDEE81ED59393}
References
- Corkami
- MSDN - Unicode Ansi
- Anti-debugging and Anti-VM techniques and anti-emulation
- Practical Malware Analysis
- Anti-debugging Techniques Cheat Sheet
- ScyllaHide.
- GetModuleHandle
- GetProcAddress
- Analyzing Hollow Processes
- Keypatch
- gynvael’s blog
- jnb instruction
- cmovnz
- MS-DOS header
- CFF explorer
- Debugging Hollow Processes